<-- click to enlarge / click para amplificar
or click here for even higher quality / o aquí para amplificar al máximo
The predictability of a system (low for certain insect plagues, for the
wheather, for heart fibrillation; high for some biorhythms and for the
phases of the moon) can be quantified by the average exponent introduced
by Lyapunov 100 years ago.
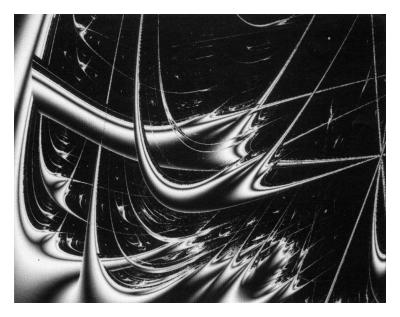
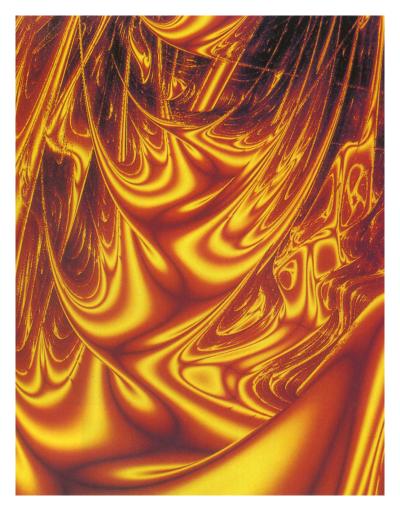
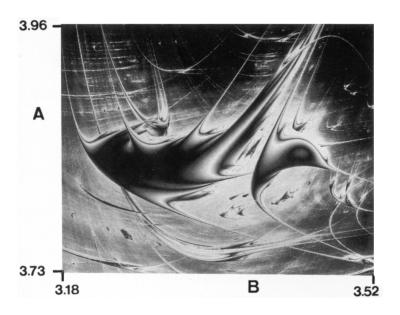
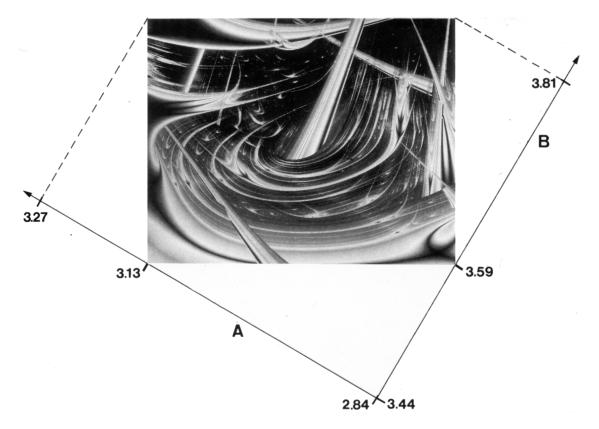
I represent Lyapunov's exponent by using grey or colour shadings on a plane that is defined by parameters that control the system. This representation leads to an easy recognition of important properties of the system: i) crossing branches indicate multistability, i.e. more than mode is possible for identical parameters, depending on the previous history of the sytem; ii) crossing branches looking transparent indicates fractal basins of attraction; iii) the "picture backround" indicates chaos; iv) dark curves on the picture foregrounds indicate superstability, i.e. the sytem is maximally robust against perturbations on these curves (this may be a desired biological or technical feature); v) highly interleaved zones of very different grey (or colour) shadings indicate structural instability.
In the web: 1, 2, 3, 4, 5, 6, 7, 8, 9, 10
![]() A.K. Dewdney, Scientific American, Sept. 1991, 178-180 / Pour la Science,
Dec. 1991,124-127 / Investigacion y Ciencia, Nov. 1991, 94-97
A.K. Dewdney, Scientific American, Sept. 1991, 178-180 / Pour la Science,
Dec. 1991,124-127 / Investigacion y Ciencia, Nov. 1991, 94-97
<-- click to enlarge / click para amplificar
or click here for even higher quality / o aquí para amplificar al máximo
![]() J. Briggs, "Chaos: Neue Expeditionen in fraktale Welten" (Hanser, Muenchen,
1993) pp.151-154 / "Fractals. The Patterns of Chaos" (Simon & Schuster,
New York, 1992)
J. Briggs, "Chaos: Neue Expeditionen in fraktale Welten" (Hanser, Muenchen,
1993) pp.151-154 / "Fractals. The Patterns of Chaos" (Simon & Schuster,
New York, 1992)
<-- click to enlarge / click para amplificar
GEO-Wissen, "Chaos und Kreativitaet" 2,1990 (several contributions in this issue)
National Geographic 175 (1989) 736-737
Natuur & Techniek 9, 720-724 (1992)
HighTech 9, 24-35 (1988)
WAZ, 17.9. 1988, (W-DO1) / 14.2.2001 (HA4)
El Mercurio (Chile), 27.3.1988, E13
Diário de Notícias (Lisboa), 5.2.1992, 41-42
![]() Daily Telegraph, Aug. 12, 1989, Weekend Mag.; pp. 20-24
Daily Telegraph, Aug. 12, 1989, Weekend Mag.; pp. 20-24
<-- click to enlarge / click para amplificar
or click here for even higher quality / o aquí para amplificar al máximo
![]() "Farbrausch aus dem Rechner bleibt doch Wissenschaft", WAZ, Germany, p. Do1, 17.9.1988
"Farbrausch aus dem Rechner bleibt doch Wissenschaft", WAZ, Germany, p. Do1, 17.9.1988
<-- click to enlarge / click para amplificar
or click here for even higher quality / o aquí para amplificar al máximo
Example with the logistic equation. Parameter-sequence: AABAB AABAB
... .
(Abscissa: A. Ordinate: B):
Example with the equation above, but with a different A-B-sequence:
Logistic equation with Parameter-sequence: ABAABBAAABBB ABAABBAAABBB ... :
Logistic equation. Parameter-sequence: AAAAABBBBB AAAAABBBBB ... :
Publications:
M. Markus, "Charts for prediction and chance", Imperial College Press, London (2007)
M. Markus, "Chaos in maps with continuous and discontinuous maxima", Computers in Physics, 481-493 and cover (1990)
M. Markus, "Lyapunow-Diagramme", Spektrum der Wissenschaft, April, 66-73 (1995) / "Los diagramas de Lyapunov", Investigacion y Ciencia, Sept., 70-77 (1995)
M. Markus and B. Hess, "Lyapunov exponents of the logistic map with periodic forcing", Computer and Graphics 13, 553-558 (1989)
M. Markus, "A scientist's adventures in Postmodernism", Leonardo 33(3),179-186 (2000)
M. Markus and B. Hess, "Fractals through periodic variation of control parameters of iterated maps on the interval", in 'Visualisierung in Mathematik und Naturwissenschaften' (ed. by H. Juergens and D. Saupe) Springer-Verlag, Heidelberg, pp. 87-101 (1989)
M. Markus and J. Tamames, "Fat fractals in Lyapunov space", in: 'Fractals in the Future' (ed. by C.A. Pickover), St. Martin's Press, N.Y. (1996), pp. 333-348
J. Roessler, M. Kiwi, B. Hess and M. Markus, "Modulated non-linear processes and a novel mechanism to induce chaos", Phys. Rev. A 39, 5954-5960 (1989)
Examples (from "Charts for prediction and chance", Imperial College Press, London 2007):